


An “Orderly” Decline Amidst the Bidenomics Disorder
A Bear Without the Bull

AS THE STOCK MARKET BEAR RISES EVER MORE ON ITS HIND LEGS, YOU MAY WANT TO CLICK HERE AND TAKE MY FREE ONLINE MACROECONOMICS COURSE ON STRATEGIC BUSINESS AND INVESTING. A PERK TO MY SUBSCRIBERS!
Hi. Peter Navarro here with the weekly economy and market rap for the week ending September 30, 2023. And let’s start with a little squib from my market wrap from my Substack dated August 12, 2023, some six weeks ago. As I wrote then:
My bottom line is that cash remains king – with “cash” now earning a nice 5% in, for example, six-month T-bills. If, however, you want to walk a little bit on the wild side – not offering advice here – a good speculation (not bet) might be SPXU, a 3X leveraged exchange trade fund that shorts the S&P 500. The Biden bear is coming; it’s only a matter of time.
Since that time, cash has indeed been if not king then certainly a safer place to be than in the US stock market. In all but one of the weeks since then, the S&P 500 index, the broadest indicator of the market, has declined while the SPXU triple short has risen from $10.65 to $11.95 today, a roughly 12% gain.
At least one stock market analyst from DataTrek Research, Nicholas Colas, has described the sell-off as “orderly,” attributing the decline to a “confluence of factors such as rising interest rates, a strengthening US dollar, soaring oil prices, and concerns about a potential government shutdown.” What comes out of Colas mouth next, however, seems like a major non-sequitur – Colas equates the orderly decline with a move “not indicative of a looming financial crisis.”
Really? Dude even suggests a buying opportunity in the not too distant future. Shades of Larry Kudlow telling people repeatedly in 2007 to “buy the dip.”
Here's arguably the smarter take: The so-called “orderly” decline we have been witnessing is nothing more than the smart Wall Street money prologue to a major market correction, anywhere from 15% to 30%. To understand this possibility, I need to offer a little primer in what’s called “technical analysis,” which is used by market analysts to identify both trends and turning points in the market.
In this case, the key technical indicator worth watching is the “On Balance Volume” indicator. It compares the stock volume on down days in the market with the stock volume on up days. Intuitively, when a pattern develops in which volume is much higher on down days then up days, that tells you that a stock, on in this case, the market itself, is under “distribution” rather than “accumulation.”
And that’s exactly what has been going on in the S&P 500 over the last six weeks. In essence, the smart Wall Street money is taking every opportunity to move out of stocks into cash while the rubes watching Brother Jim Cramer at CNBC or Brother Larry Kudlow at Fox Business continue to “buy the dips.”
As to why the smart Wall Street money doesn’t bail all at once if it thinks the market is trending down, it’s not that simple. The amounts of money held in stocks by major hedge funds and investment funds are so big that any big withdrawals would so move prices down that it would be a self-inflicted wound.
So the smart money beats a quiet and orderly retreat, which is nicely revealed by the On Balance Volume technical indicator.
Of course, the retreat only remains orderly until retail investors finally notice big bites are being taken out of their 401k’s. Then, they panic, and call their brokers to sell, sell, sell.
That day is coming, and anybody who thinks we are not in now for a major leg down isn’t paying attention to all of the major macro forces bearing down via Bidenomics on us – see my last Substack for a drill down.
Let’s finish this up then with the numbers for the week, a quick chart, and little bit more info about technical analysis as it pertains to the S&P 500 and SPXU triple.
For the week, the S&P fell modestly by 0.3% to close out the month. More broadly, the S&P 500 finished September down nearly 5% for its ugliest month since March 2020, this when the pandemic caused a major market sell-off. The S&P 500 also closed 5% below its record high for the first time this year.
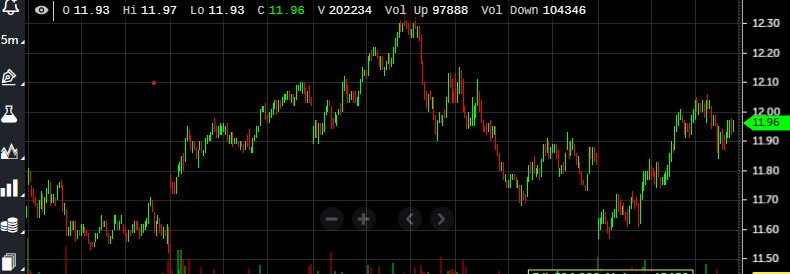
The 5-day chart of SPXU for the week below shows the wild daily ride behind the modest 0.3% decline. You can see in the chart a massive surge up from Monday to Wednesday, with SPXU hitting a peak of $12.30. Over the next several days, it would careen down to as lows as $11.50 before settling in at the end of the week for a modest gain at 11.96.
I offer this chart to reinforce the point that it is important to maintain your conviction about market direction during daily swings. It would have been easy to get shaken out of SPXU this last week given the roller coaster, but that’s where technical analysis can come in handy.
The way I consume my technical analysis is through a website at www.marketedge.com and I’ve been using it for years. Check it out for free by going to the site and typing in SPY, the exchange-traded fund for the S&P 500, in the free box.
Just this week, Market Edge issued an avoid signal for SPY. Noted Market Edge on the On Balance Volume indicator:
“Over the last 50 trading sessions, there has been more volume on down days than on up days, indicating that SPY is under distribution, which is a bearish condition. The stock is trading below a falling 50-day moving average which confirms the weak technical condition of SPY. SPY could find secondary support at its rising 200-day moving average.”
Okay, that’s it for the market rap. Note that I am not giving market advice. I’m simply reflecting on my own market posture based on my read of the macroeconomics landscape.
The conservative play now is clearly cash parked in short-term money market instruments now yielding as much as 5%.
Last take: I strongly urge all those with a job or a retirement fund on the line to watch the financial press closely now and perhaps elevate your macroeconomic literacy. To that end, I’m once again offering a free coupon to take my online Strategic Macroeconomics for Business and Investing, which I taught for years at the University of California.
Just CLICK HERE for the coupon or, if you are listening by podcast, just to go to www.peternavarro.substack.com for the coupon at the end of this article! That www.peternavarro.substack.com.
Peter Navarro. Out.
Awesome insight as always, striking a good balance between meatier analysis in the terms that most of us can understand. It just doesn’t make sense to me as an investor to risk capital in the markets when I can earn 5% virtually risk free. I am building a list of blue chip stocks to potentially buy when we near a bottom.
Thanks for the analysis!